


Energy from Waste
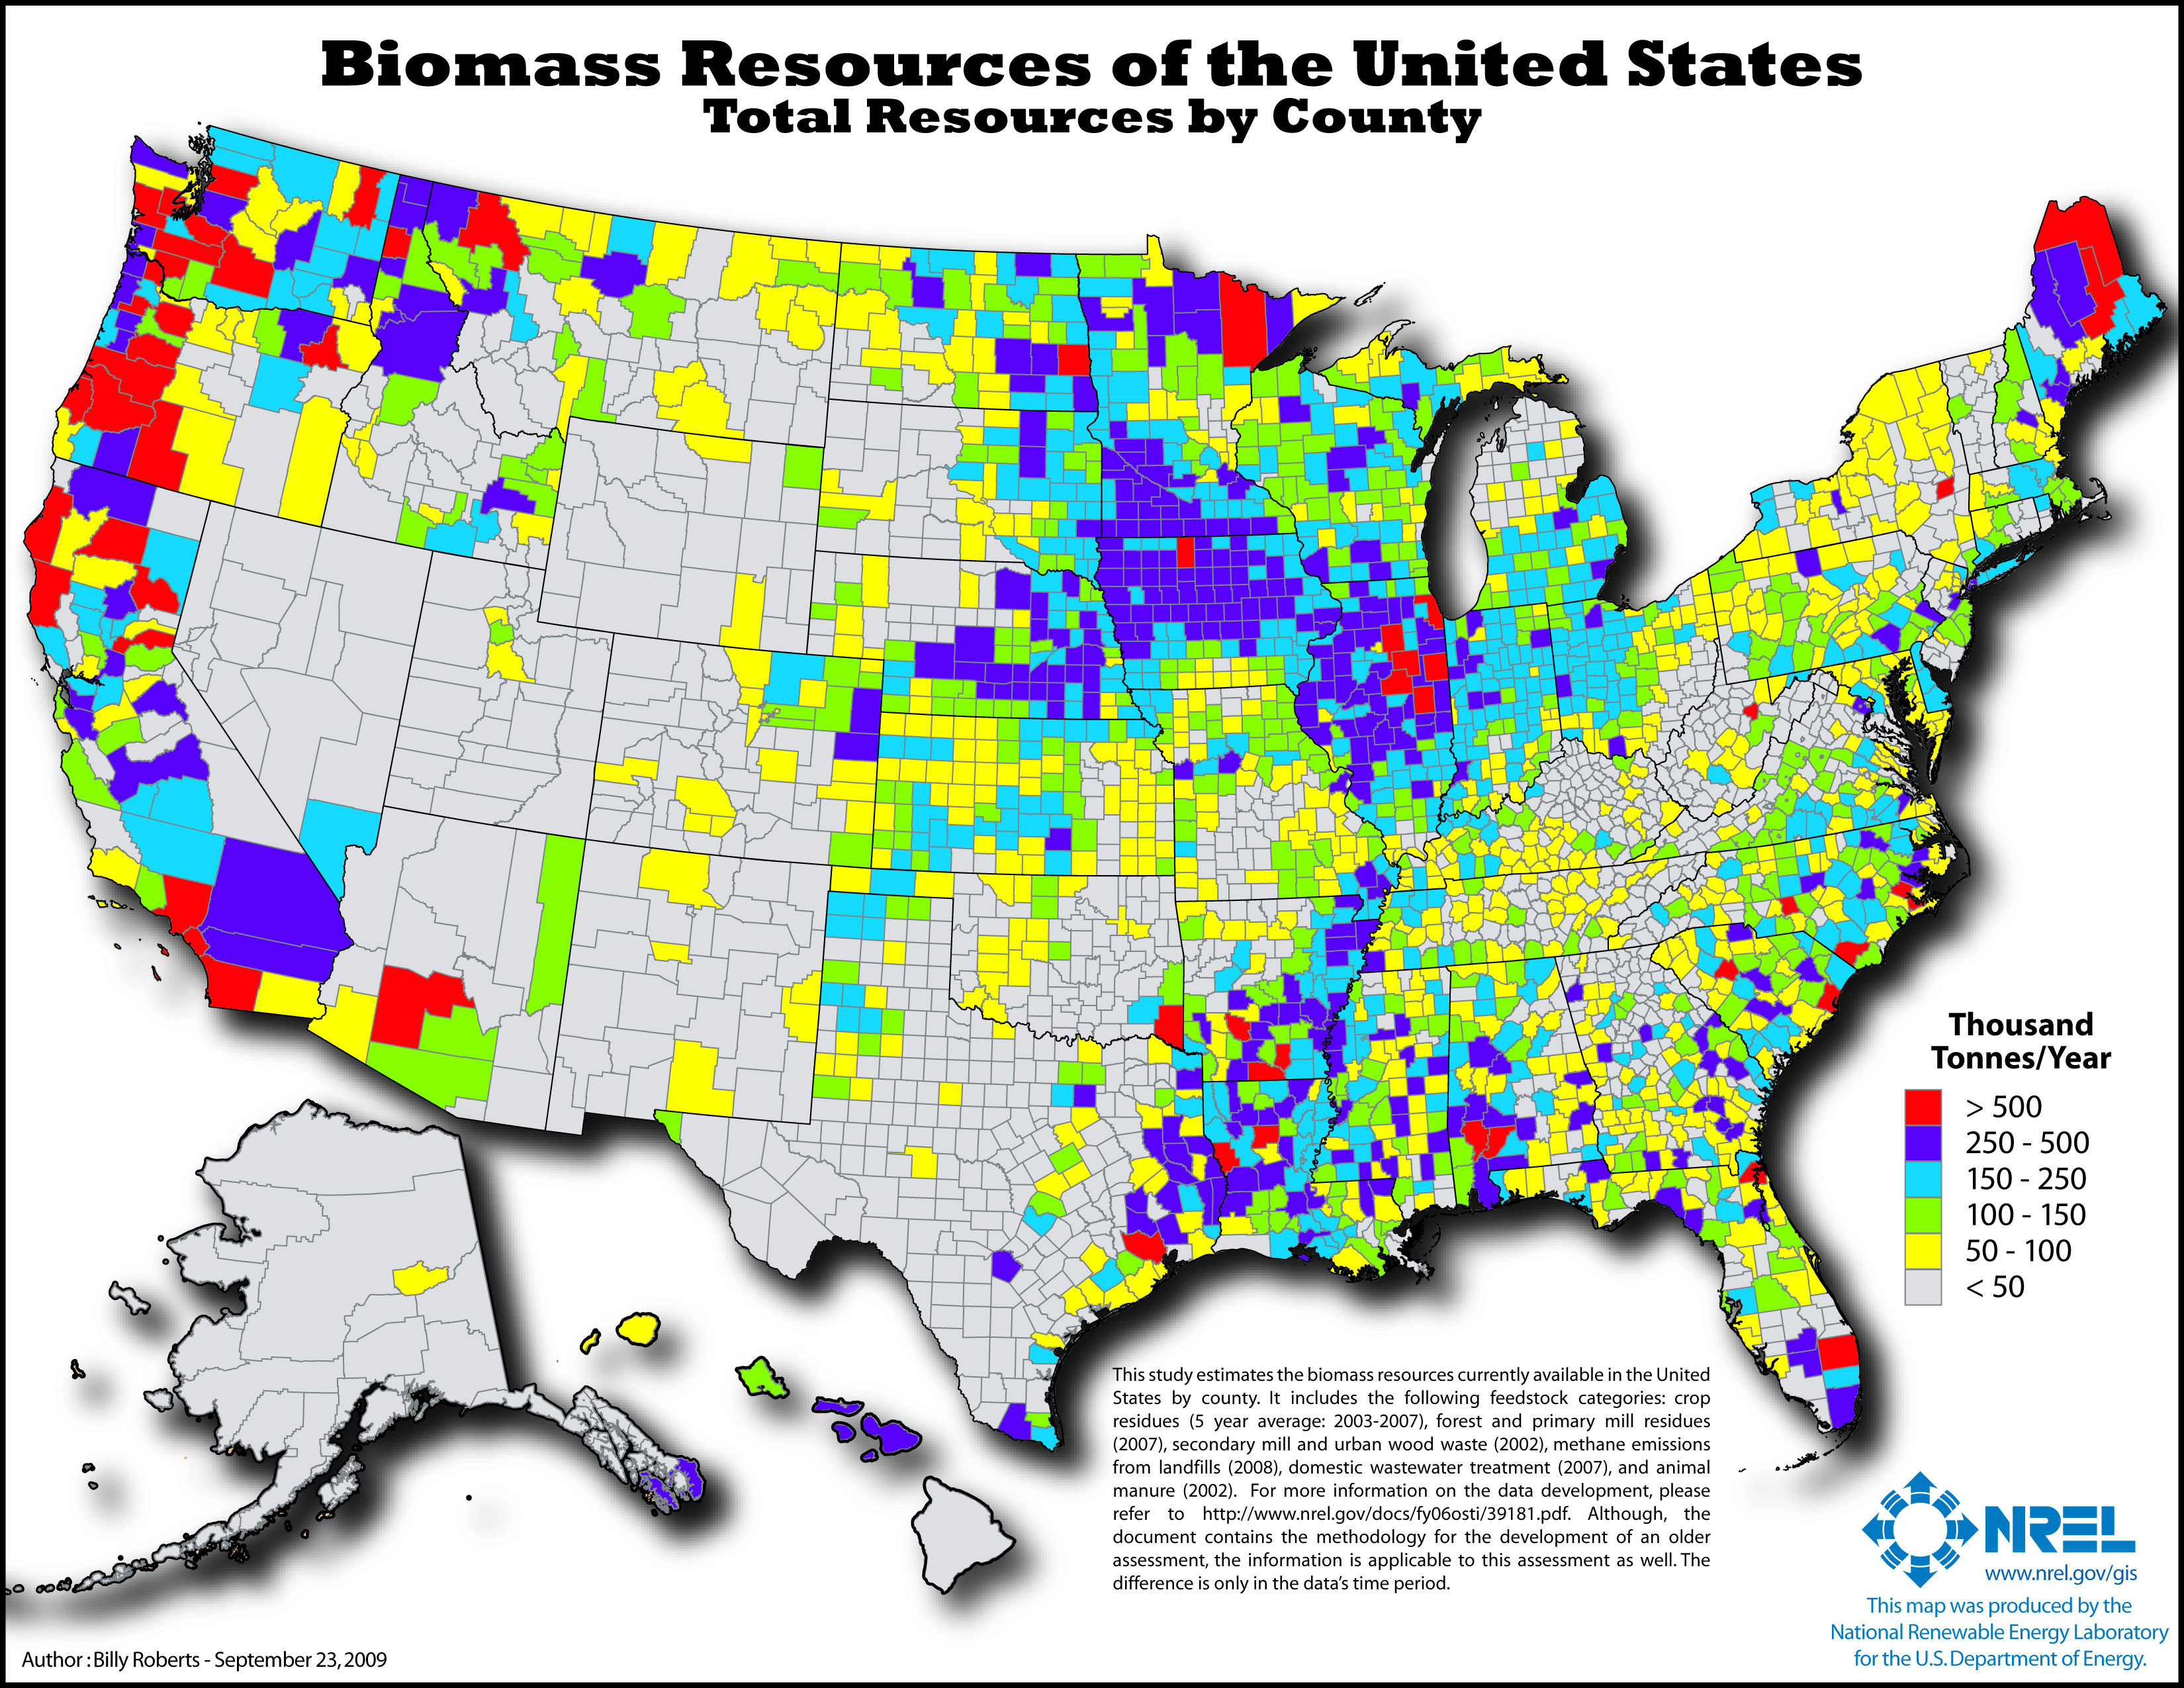
Total U.S. biomass resources
Displayed here are maps and information from the U.S. National Renewable Energy Laboratory on potentially energy-producing waste products from agriculture and wood products industries. In the past, these residues went to landfill or were left to rot; but since all organic matter contains energy, the opportunity exists to harvest that energy by converting it to electricity. The last three maps show available methane gas in landfills, manure and sewage. When methane is allowed to dissipate into the atmosphere, it contributes to the greenhouse effect, trapping heat near Earth’s surface. Capturing the methane and using it as fuel thus has a double benefit. The maps on this page are the most up-to-date available as of February 3, 2011.
Note that some crops are now grown specifically to generate energy in the form of biofuel (ethanol); this page only covers biomass that is created as a byproduct of other industries.
Total Biomass Resources in the United States
(View/Download/Print JPG 1.5 MB)
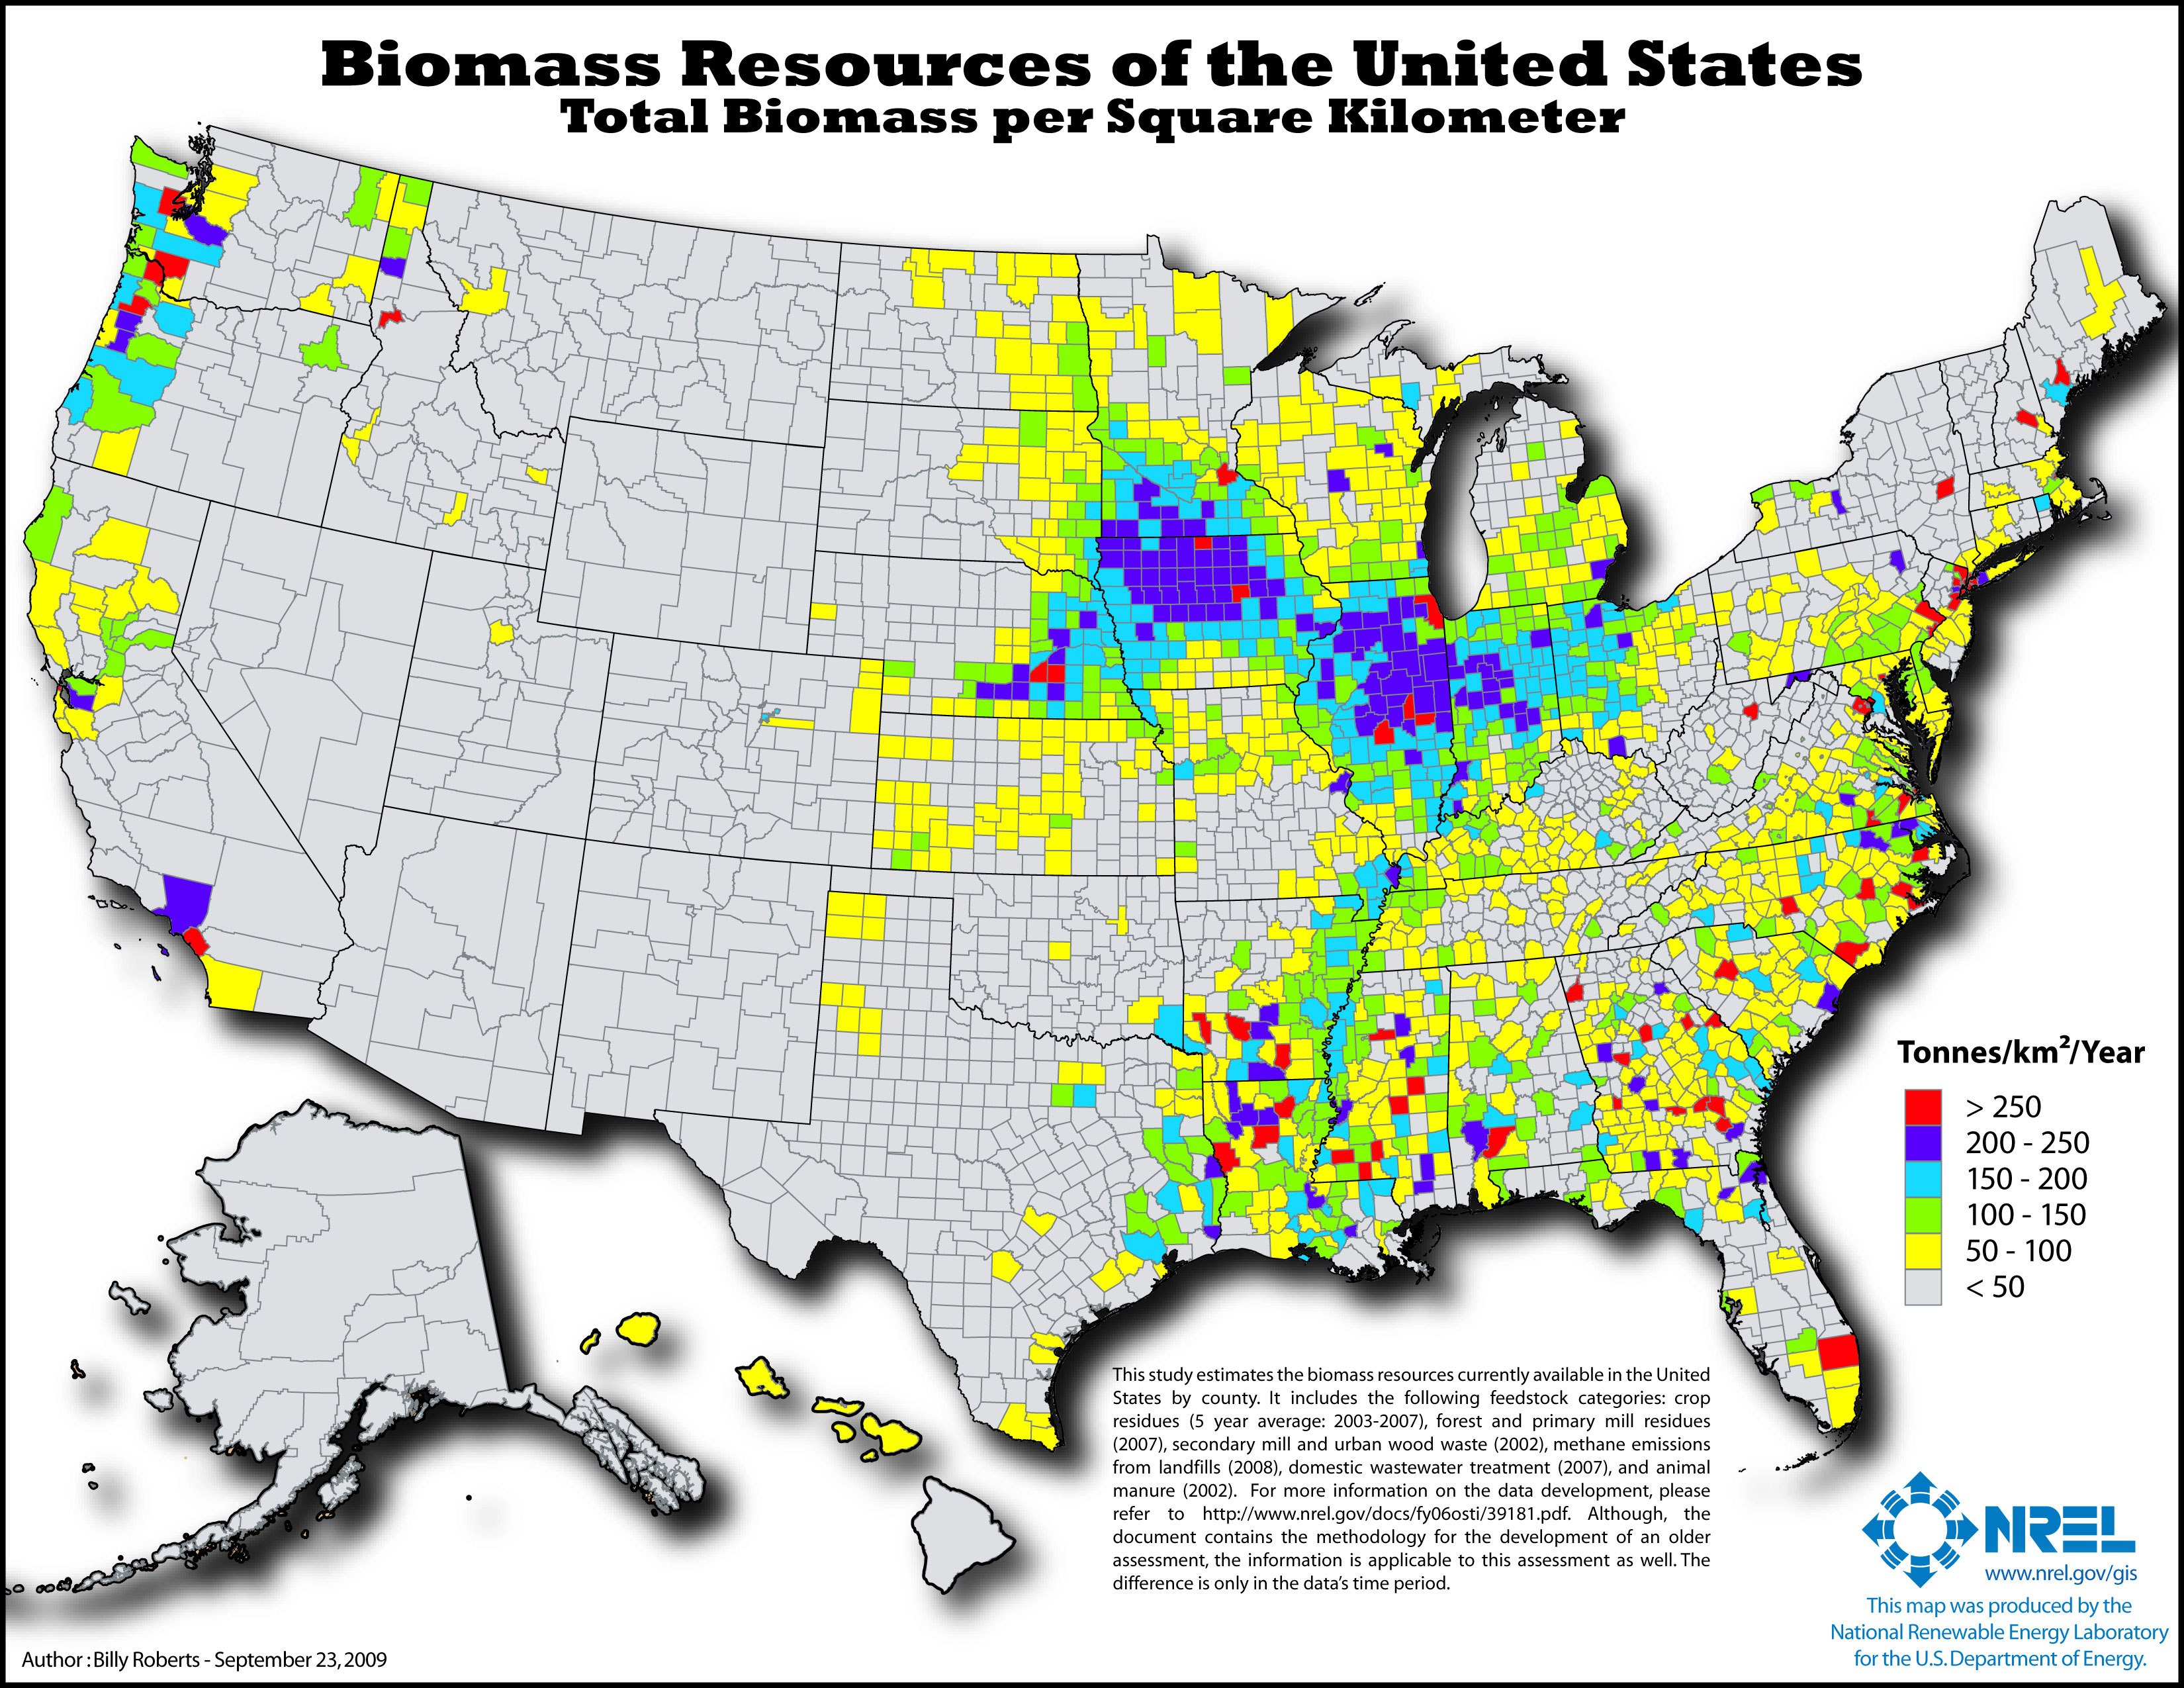
Total Biomass Resources per Square Kilometer
Total Biomass Resources per Square Kilometer in the United States
(View/Print/Download JPG 1.5 MB)
Energy from Crop Production Waste

Crop residues
The following crops were included in this analysis: corn, wheat, soybeans, cotton, sorghum, barley, oats, rice, rye, canola, dry edible beans, dry edible peas, peanuts, potatoes, safflower, sunflower, sugarcane, and flaxseed. The quantities of crop residues that can be available in each county are estimated using total grain production, crop to residue ratio, moisture content, and taking into consideration the amount of residue left on the field for soil protection, grazing, and other agricultural activities.
(View/Print/Download JPG 1.5 MB)
Energy from Logging Waste
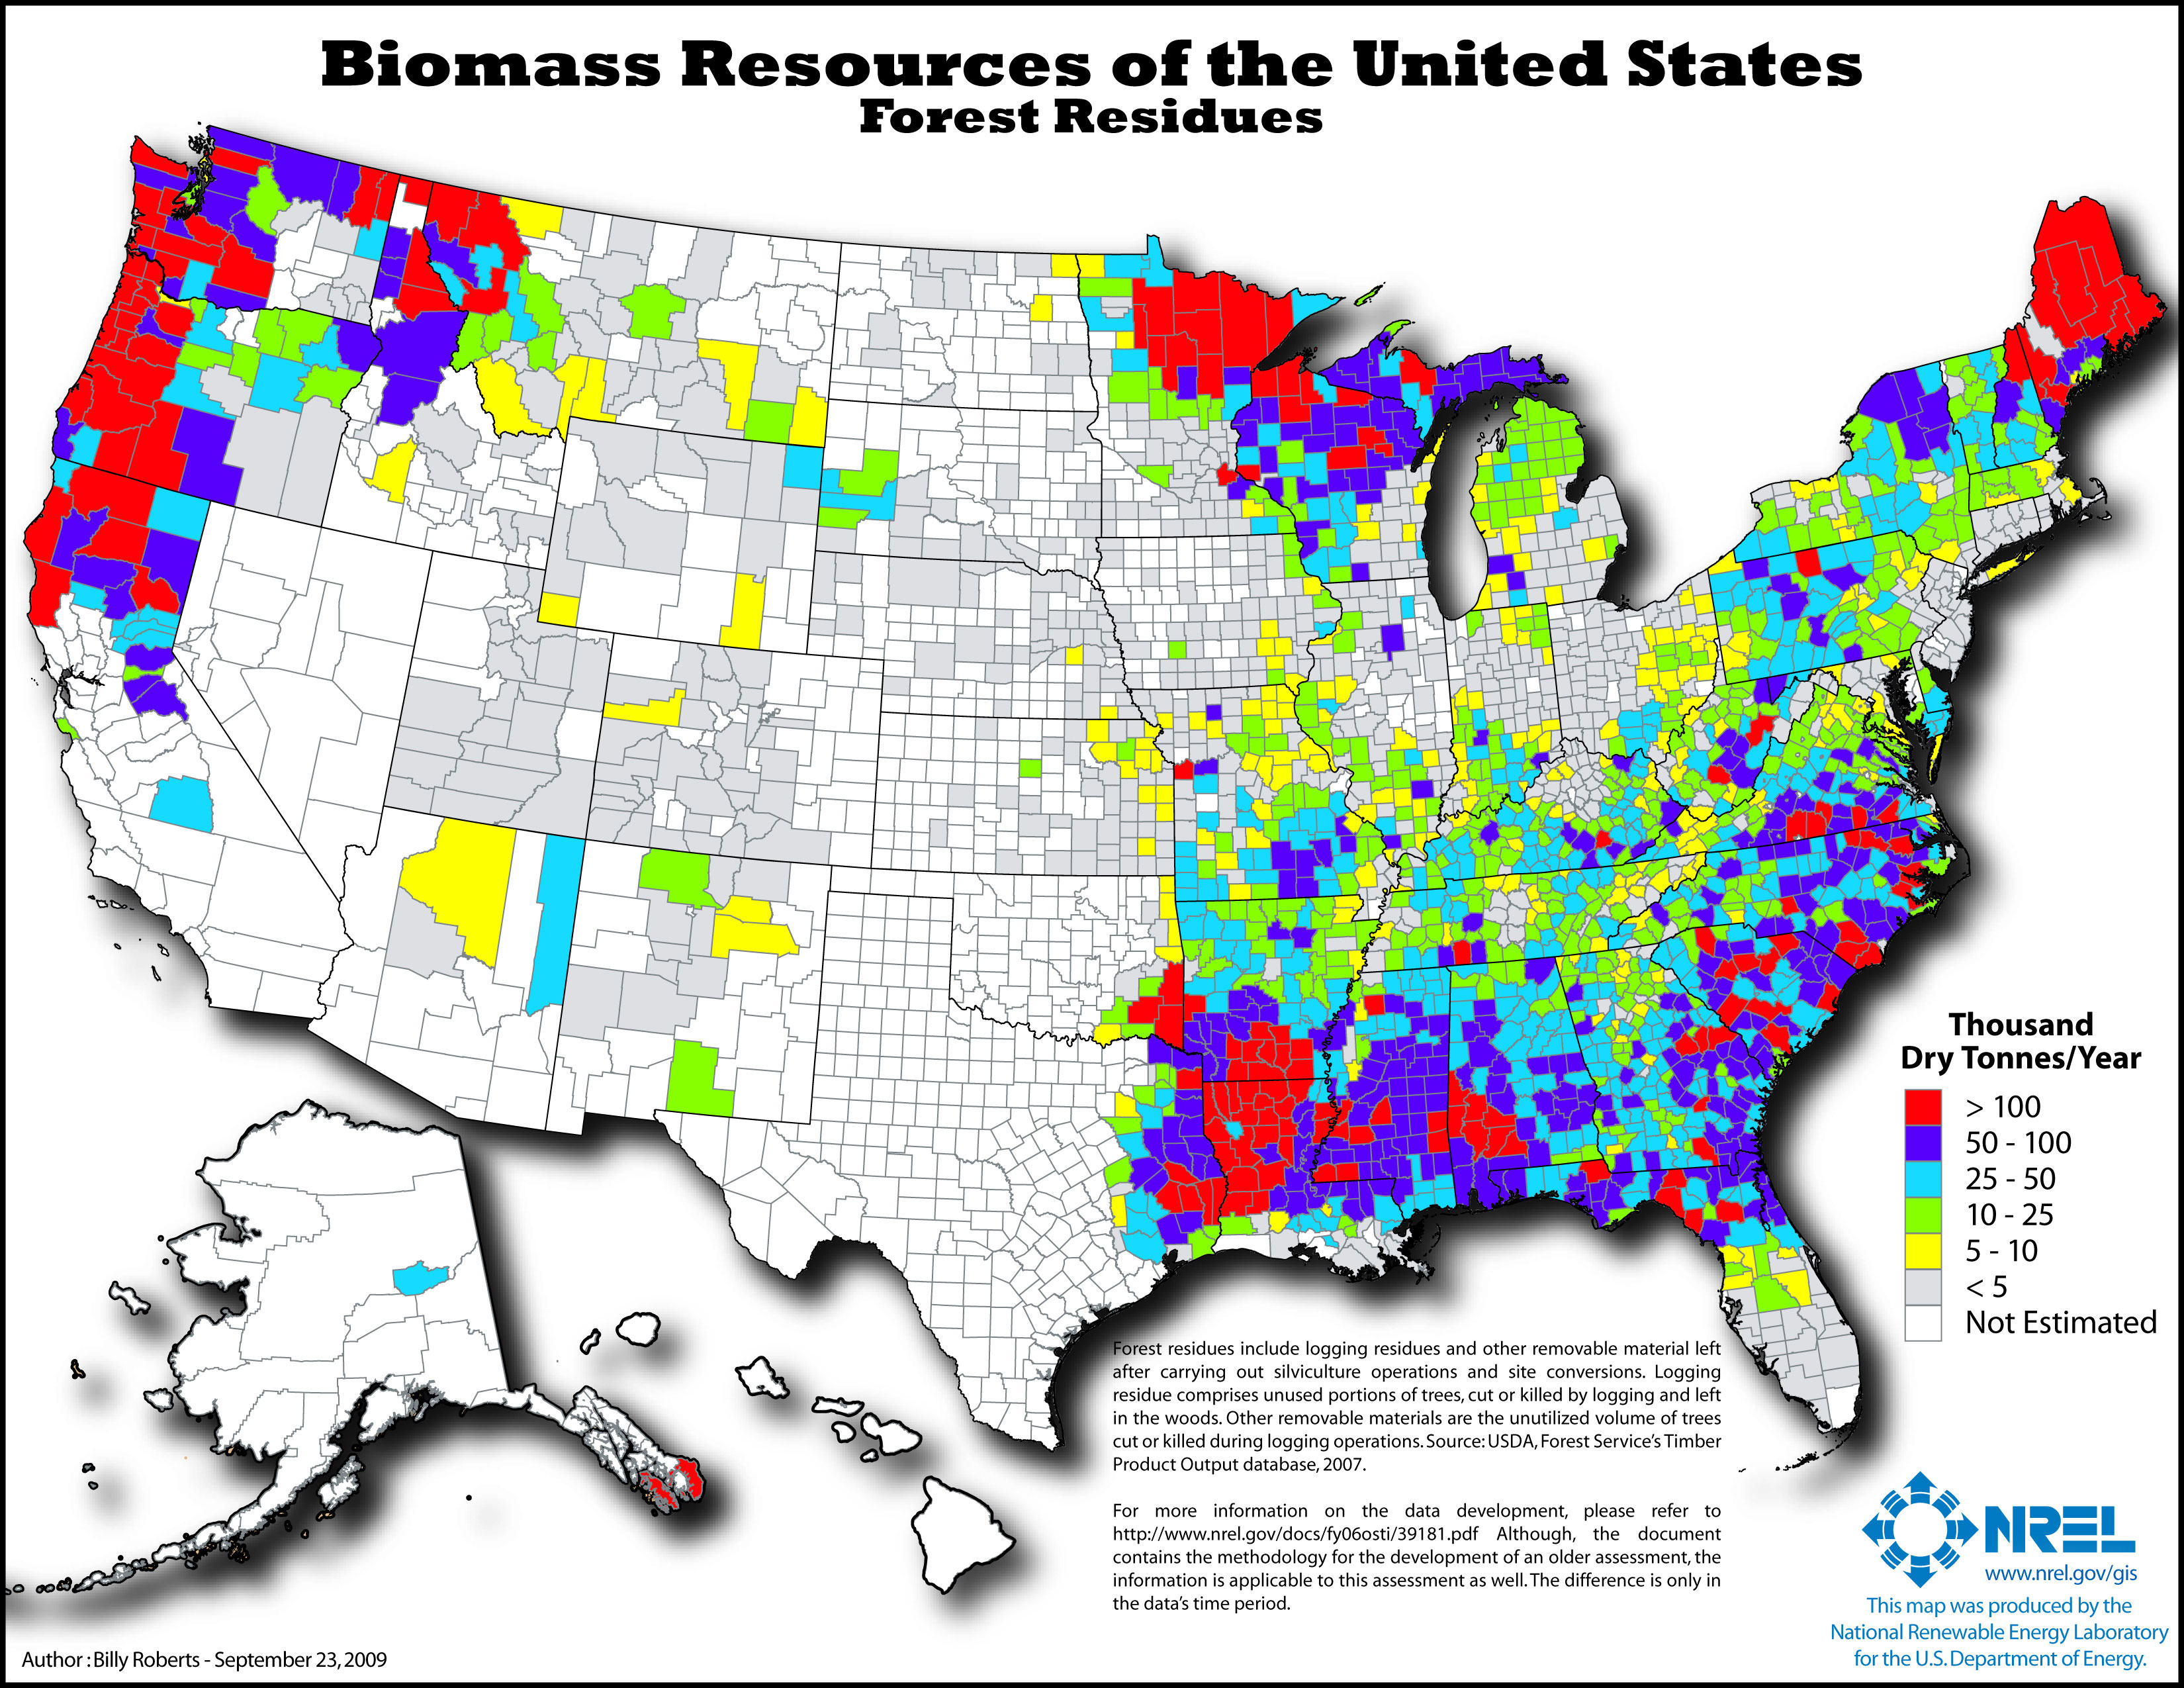
Forest residues
This category includes logging residues and other removable material left after carrying out silviculture operations and site conversions. Logging residue consists of unused portions of trees cut or killed by logging and left in the woods. Other removable materials are the unutilized volume of trees cut or killed during logging operations.
(View/Print/Download JPG 1.6 MB)
Energy from Milling Waste
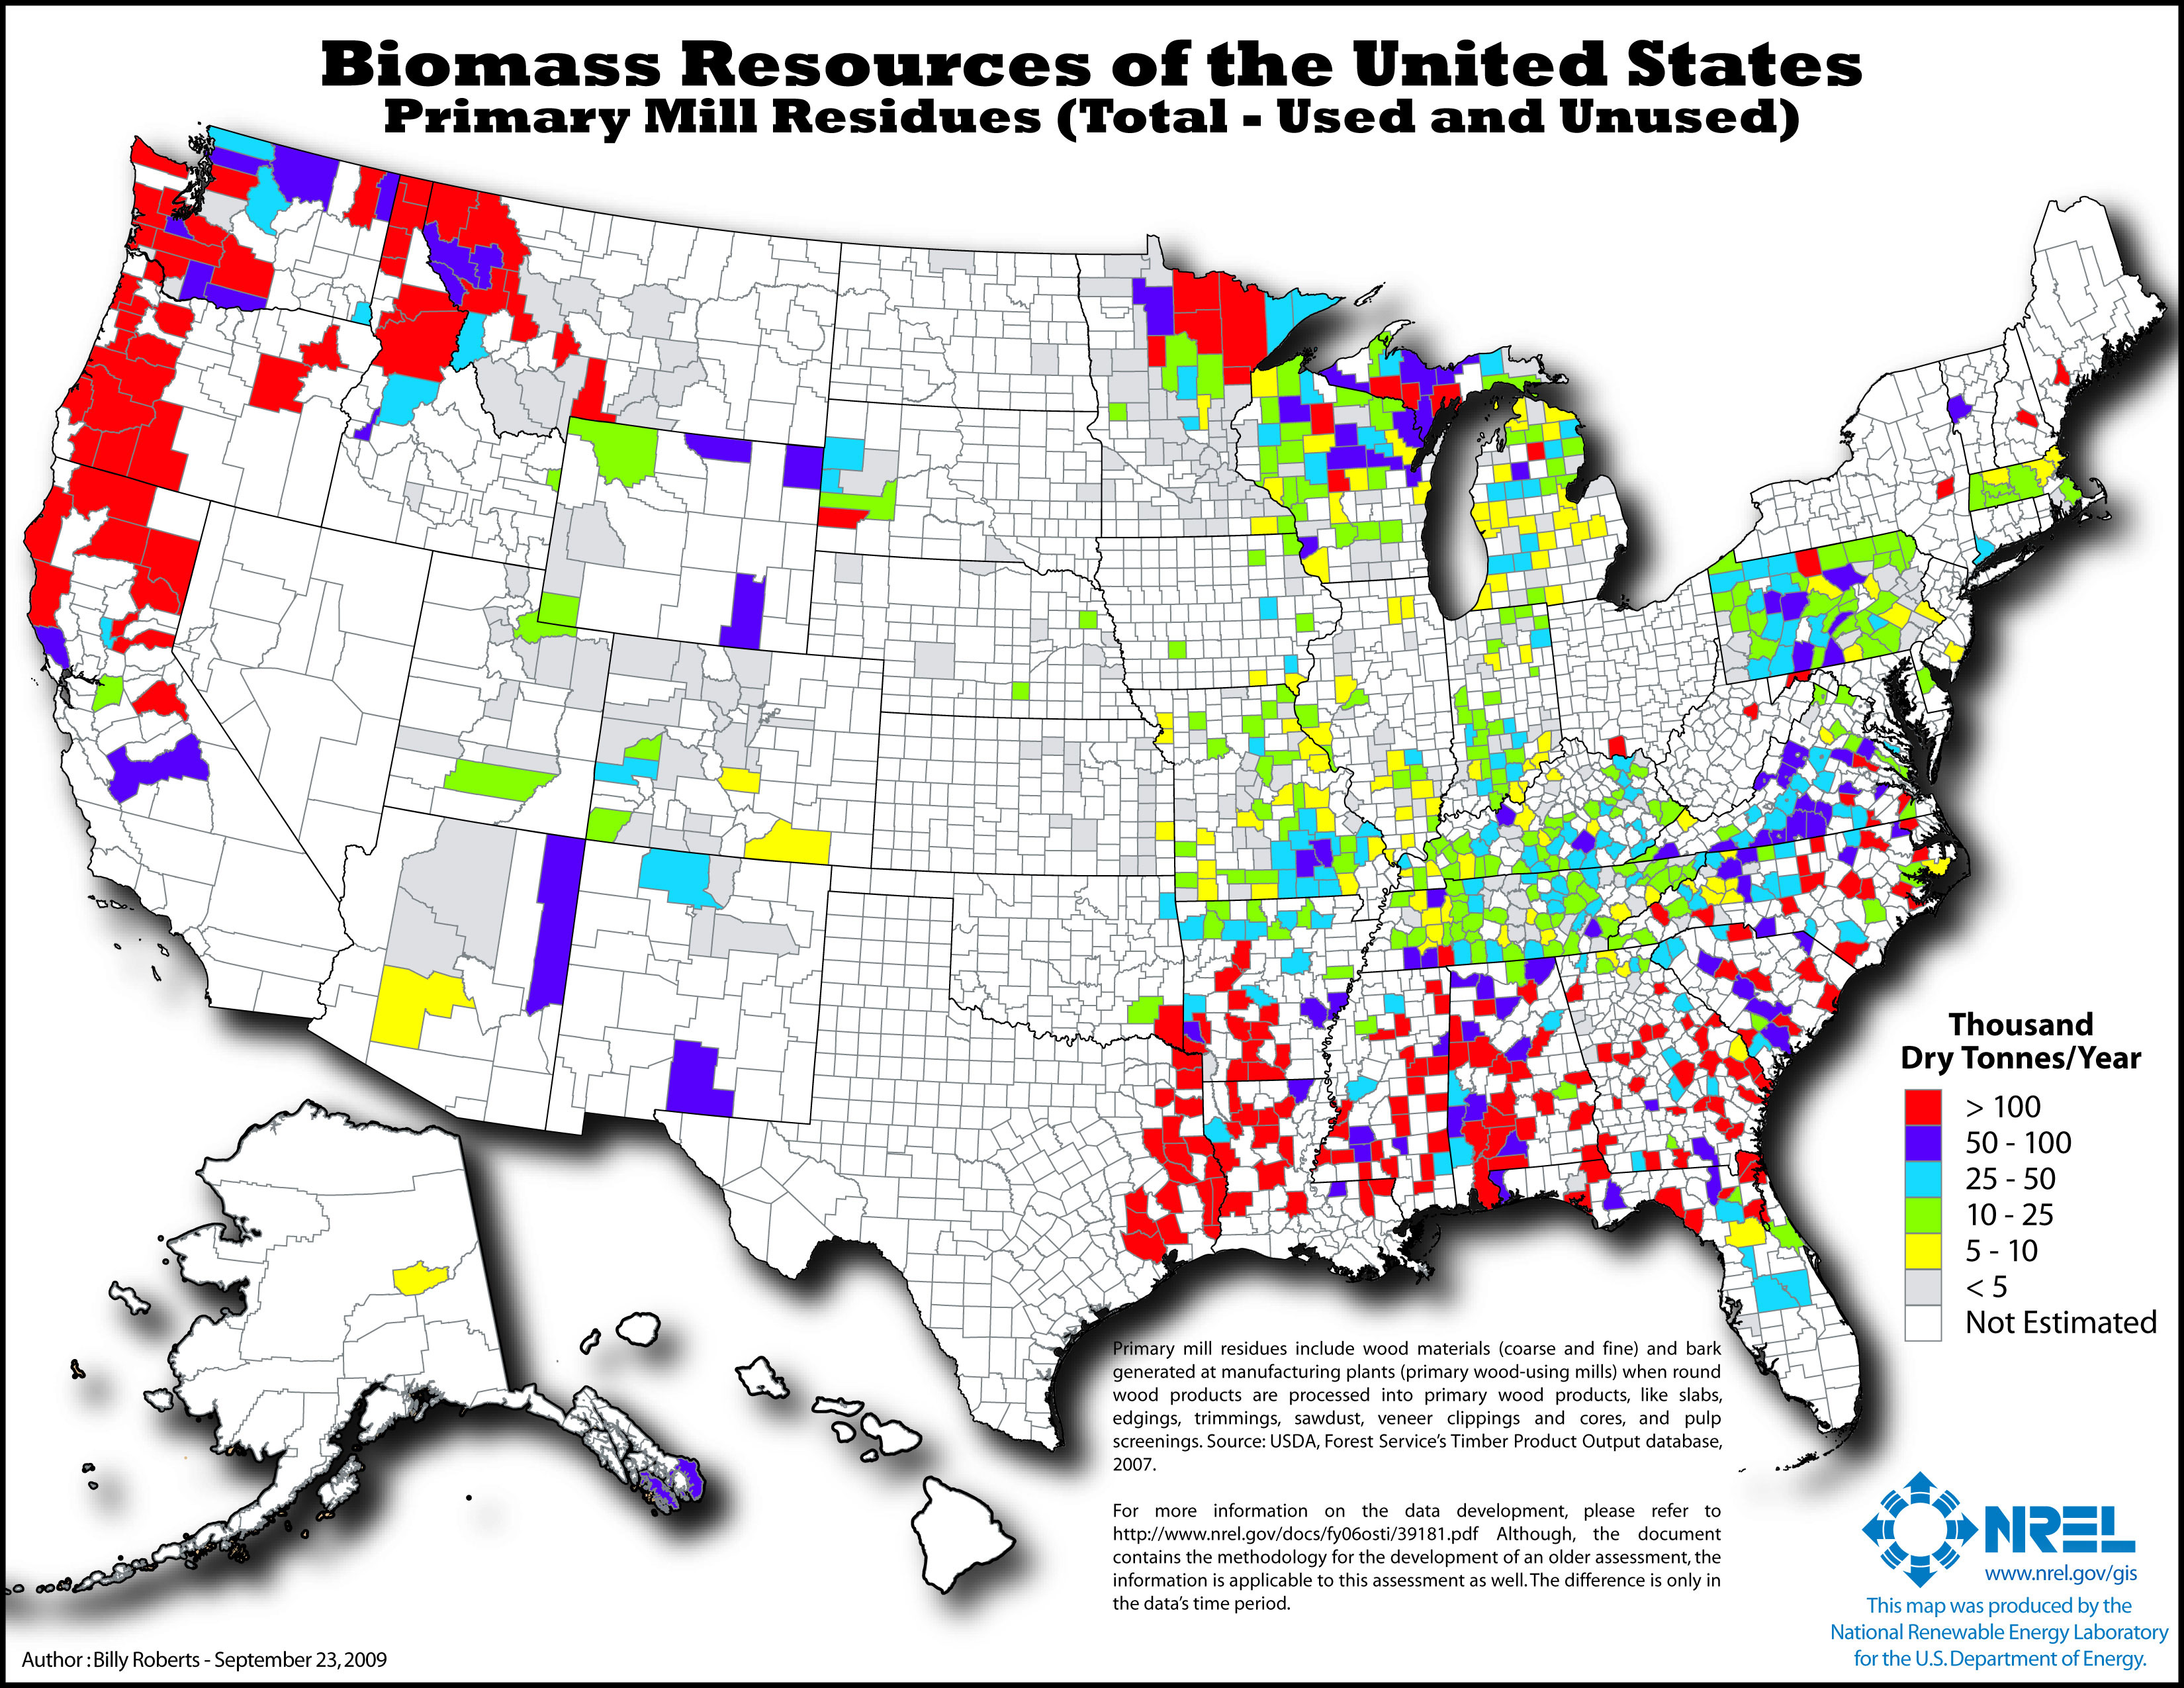
Primary mill residues
Primary mill residues include wood materials (coarse and fine) and bark generated at manufacturing plants (primary wood-using mills) when round wood products are processed into primary wood products, such as slabs, edgings, trimmings, sawdust, veneer clippings and cores, and pulp screenings.
(View/Print/Download JPG 1.5 MB)
Energy from Woodworking Waste
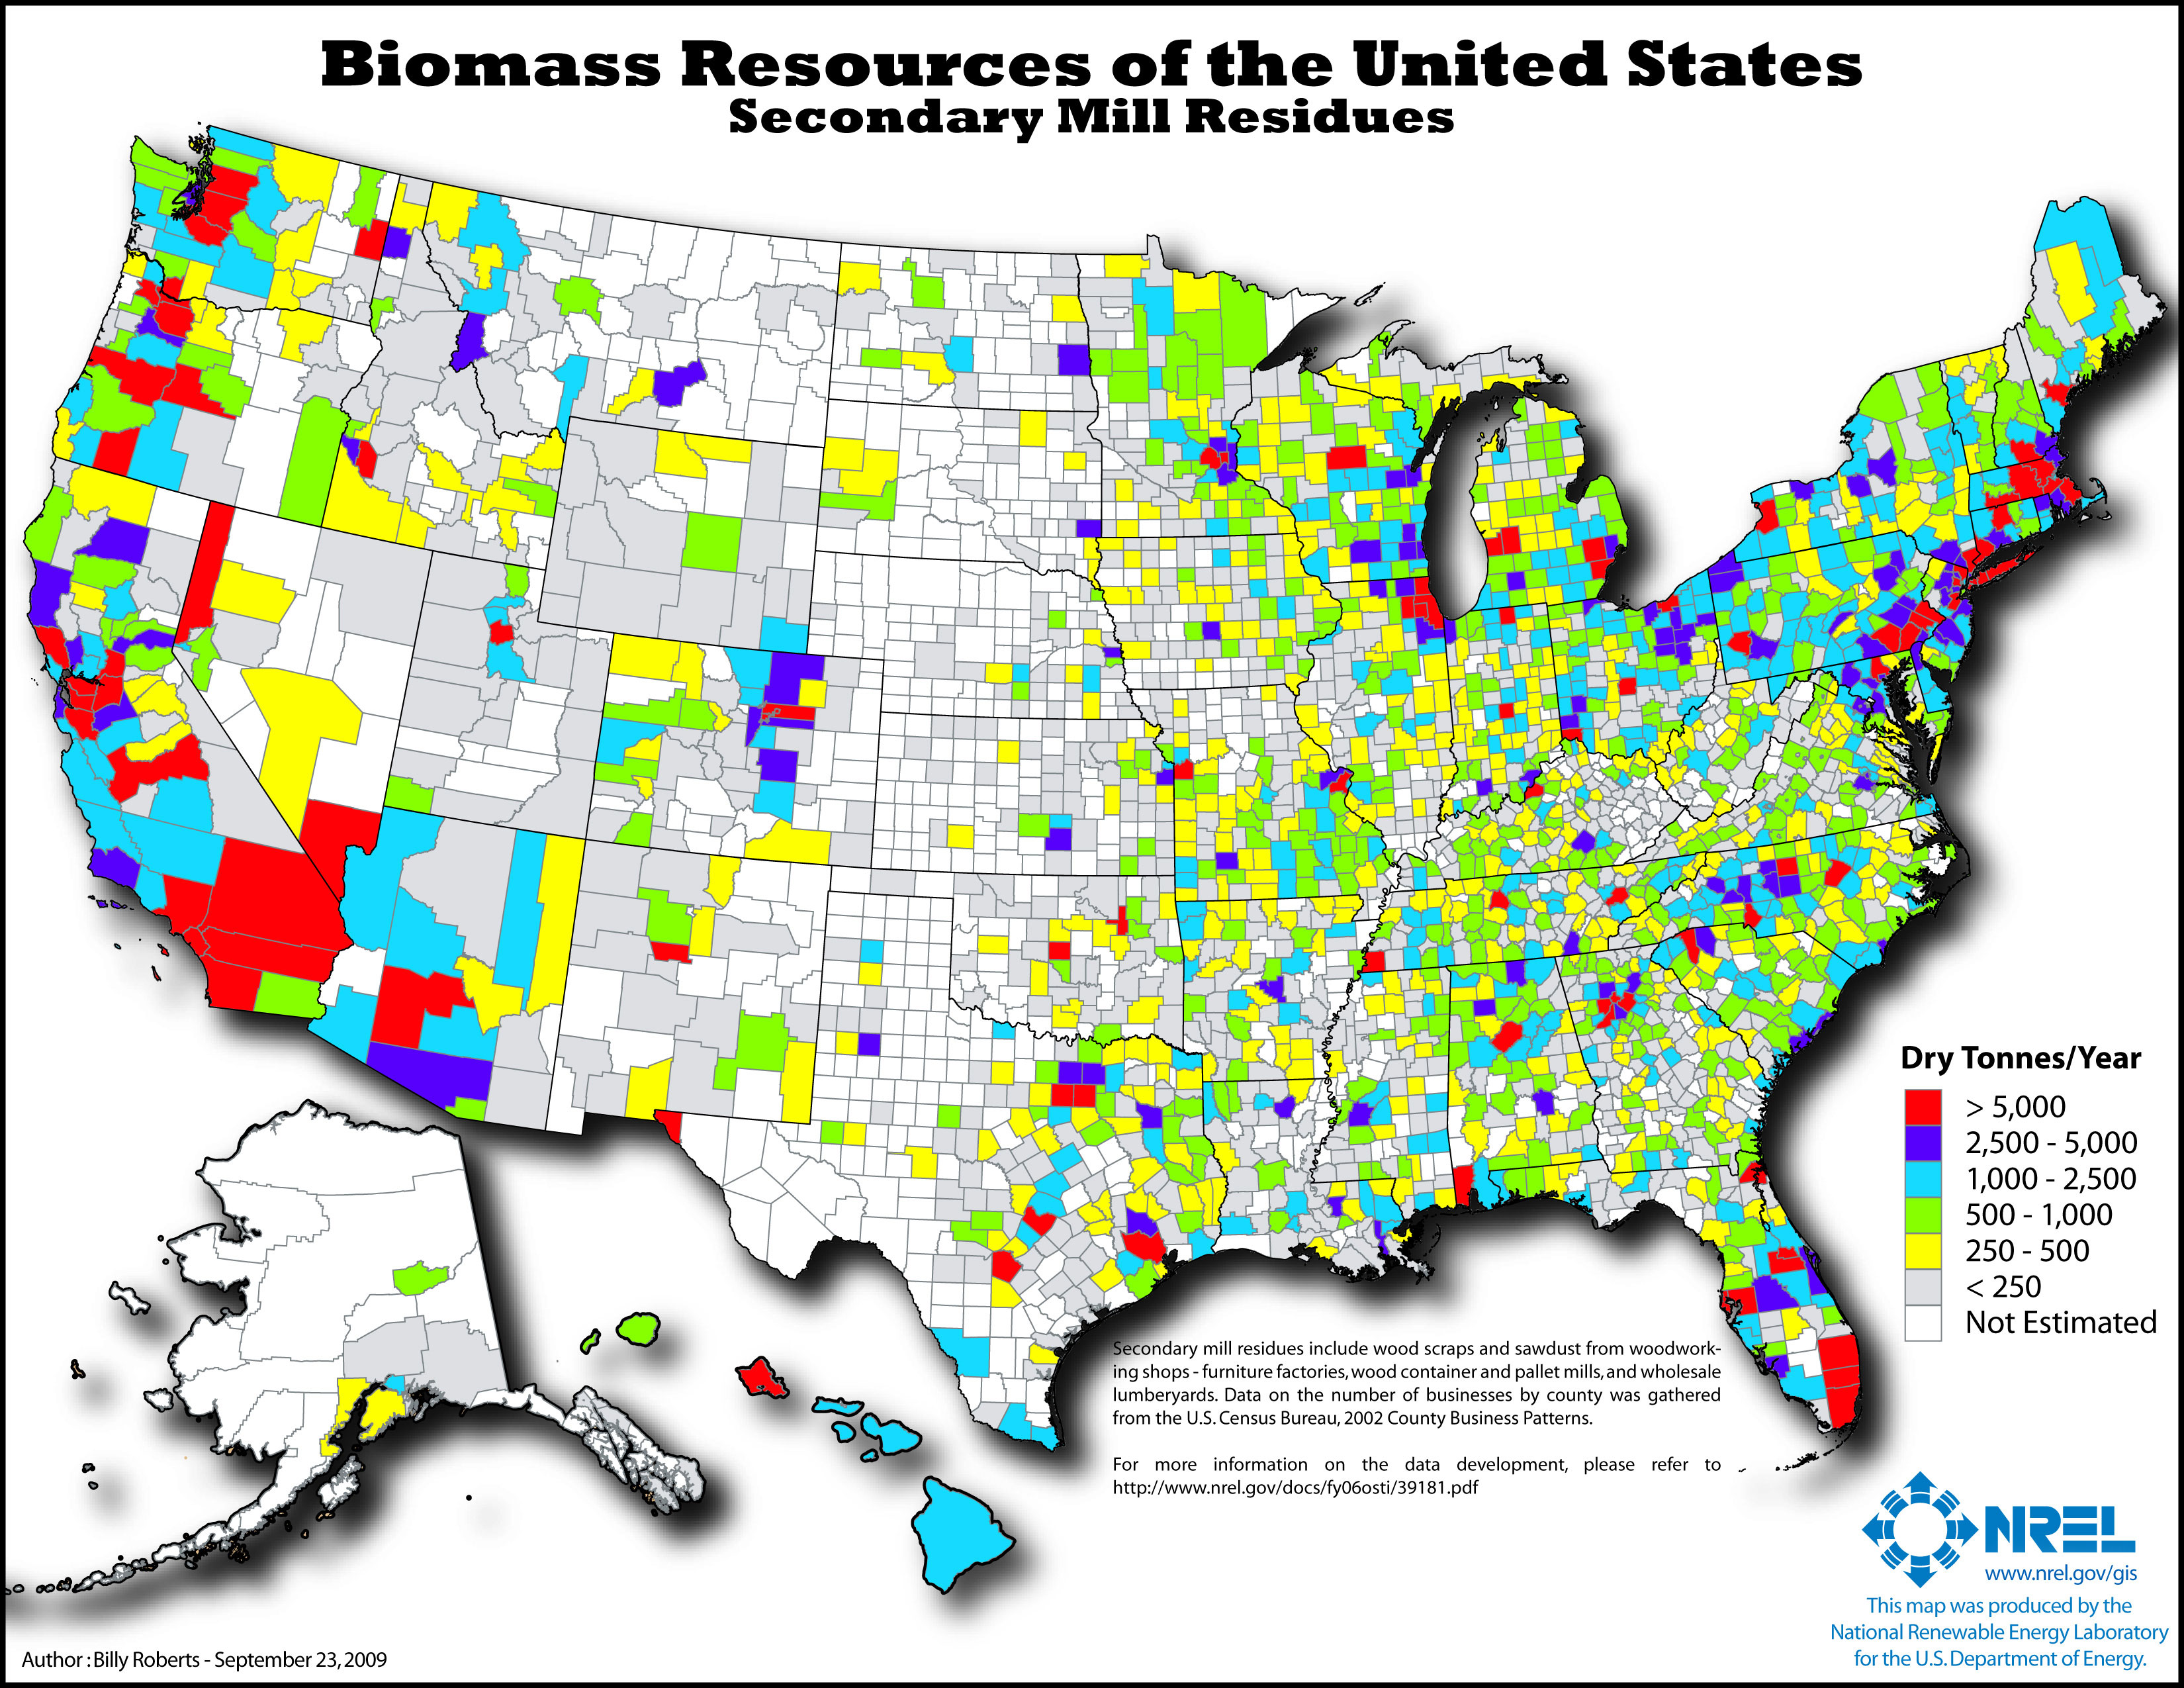
Secondary mill residues
Secondary mill residues include wood scraps and sawdust from woodworking shops — furniture factories, wood container and pallet mills, and wholesale lumberyards. Data on the number of businesses by county was gathered from the U.S. Census Bureau, 2002 County Business Patterns.
(View/Print/Download JPG 1.5 MB)
Energy from Urban Wood Waste
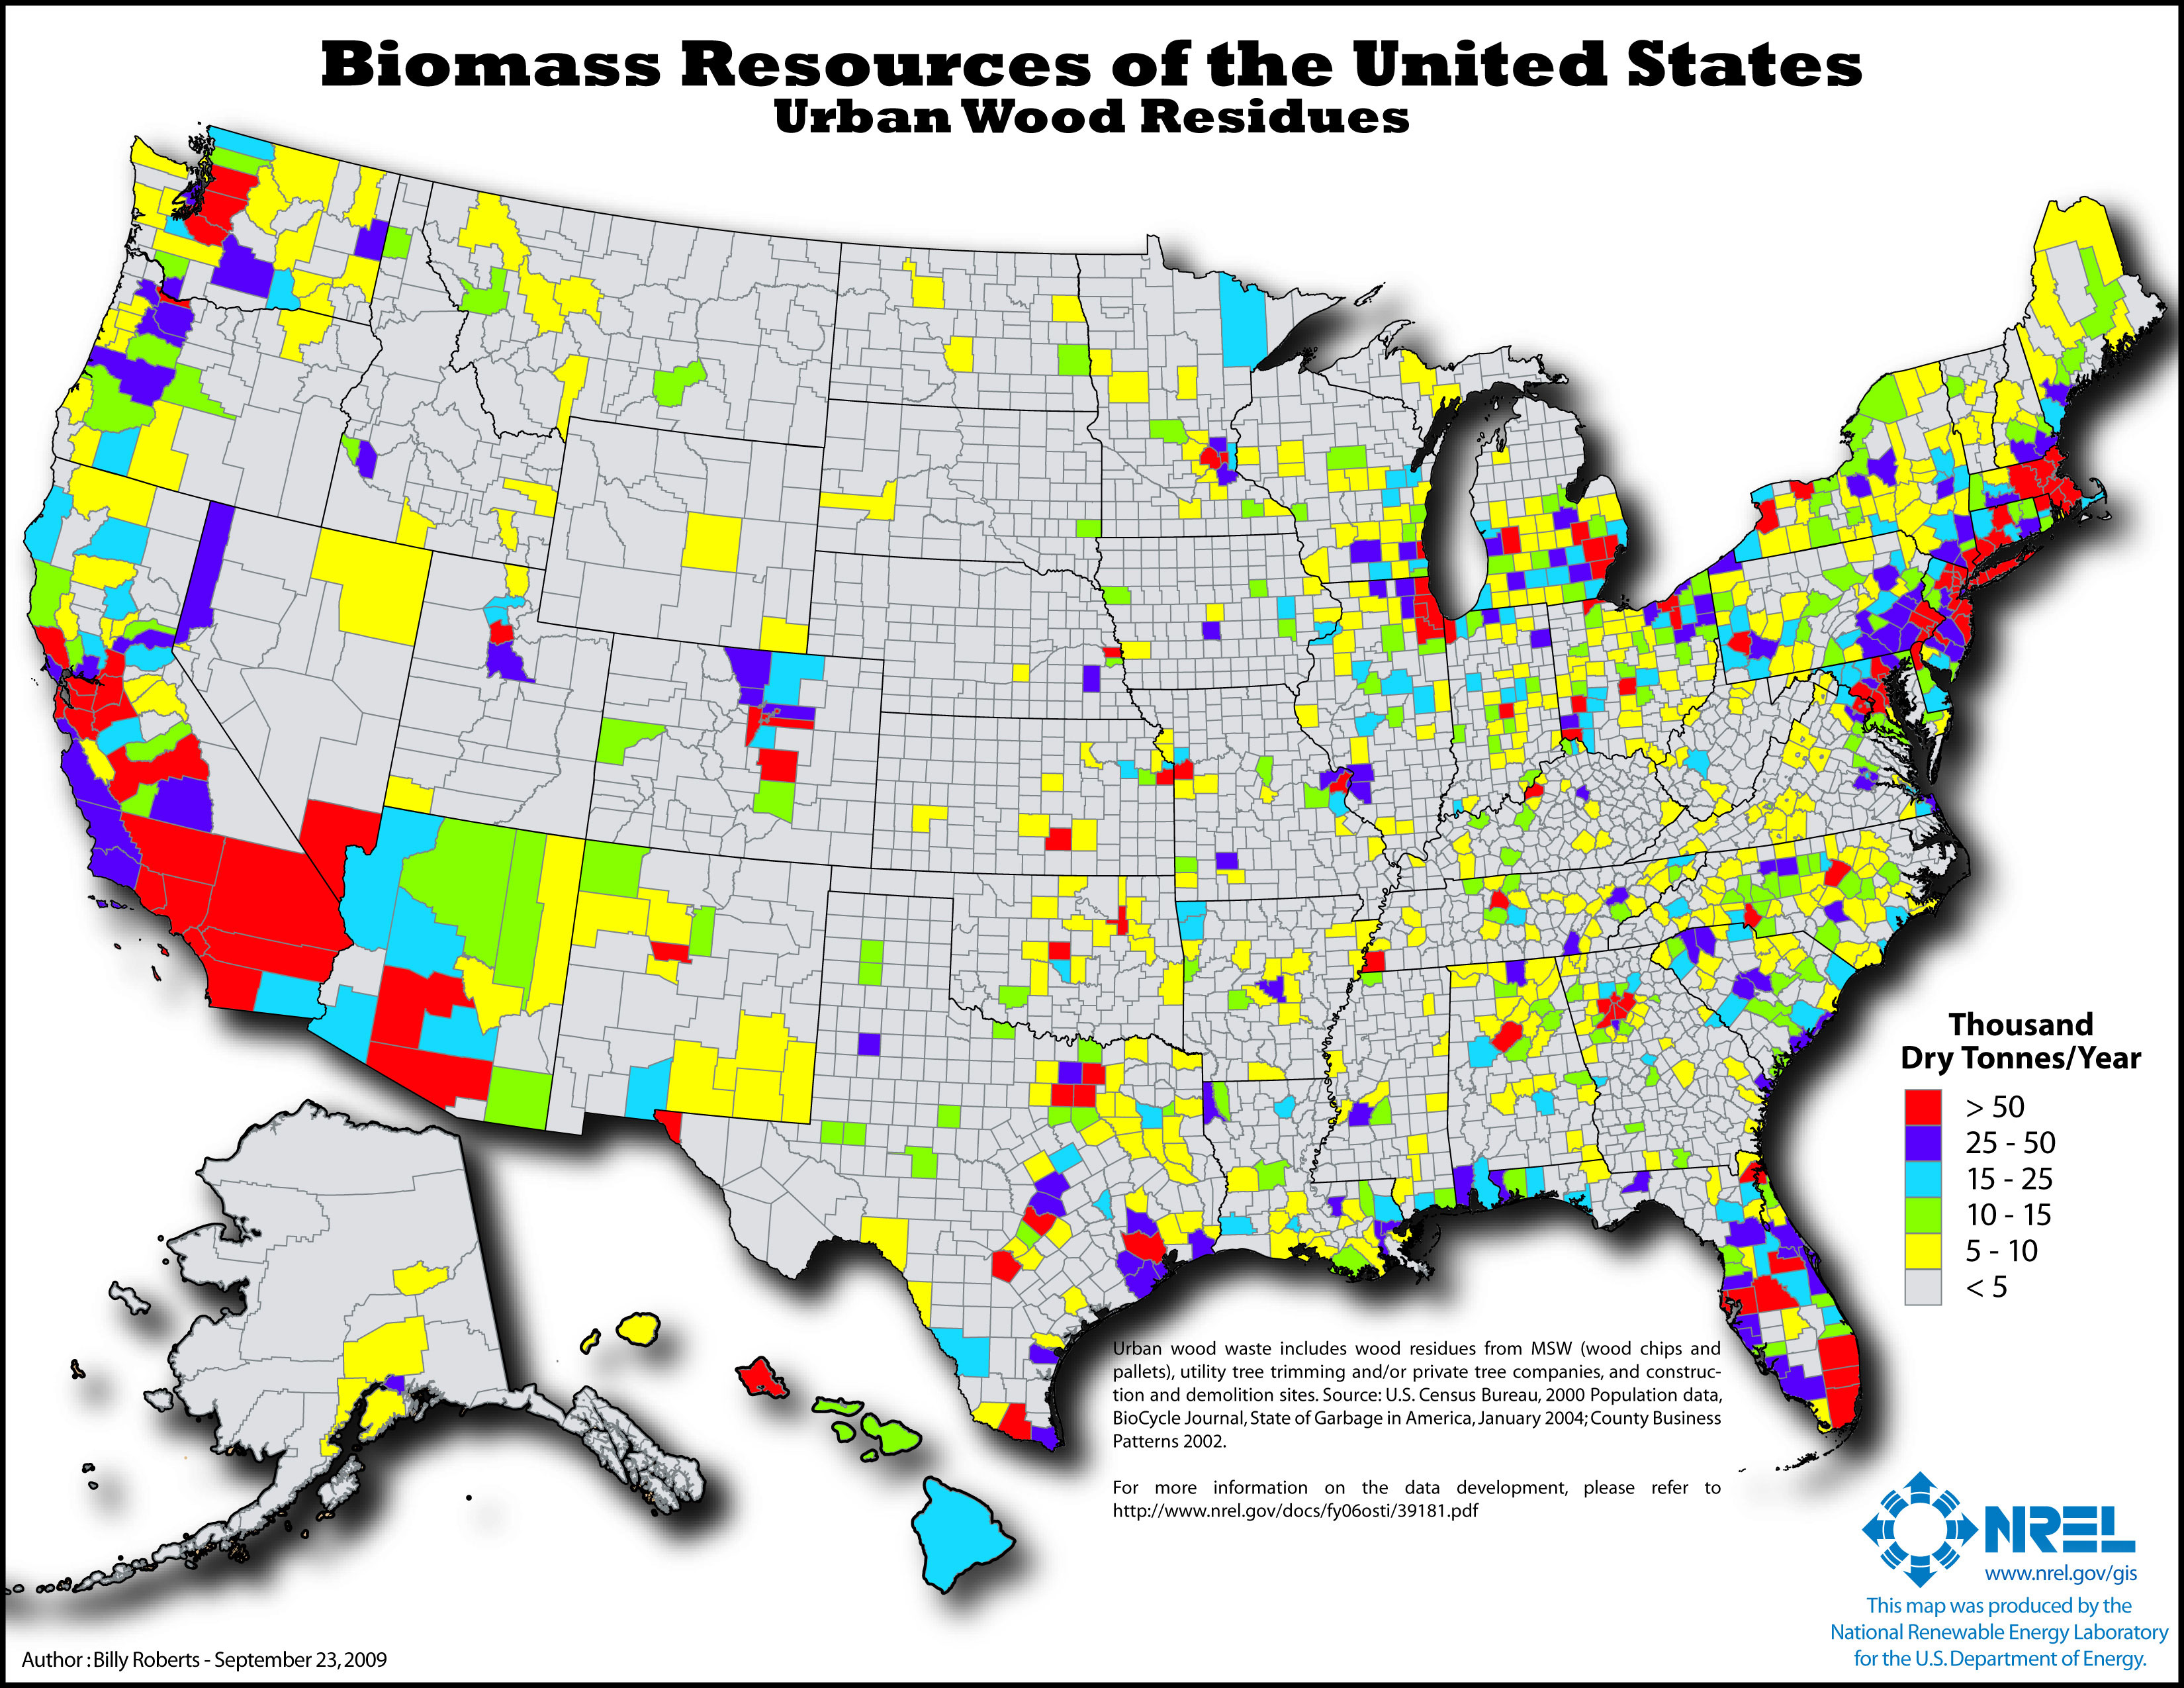
Urban wood waste
Urban wood waste includes wood residues from MSW (wood chips and pallets), utility tree trimming and/or private tree companies, and construction and demolition sites.
(View/Print/Download JPG 1.5 MB)
Gas from Garbage
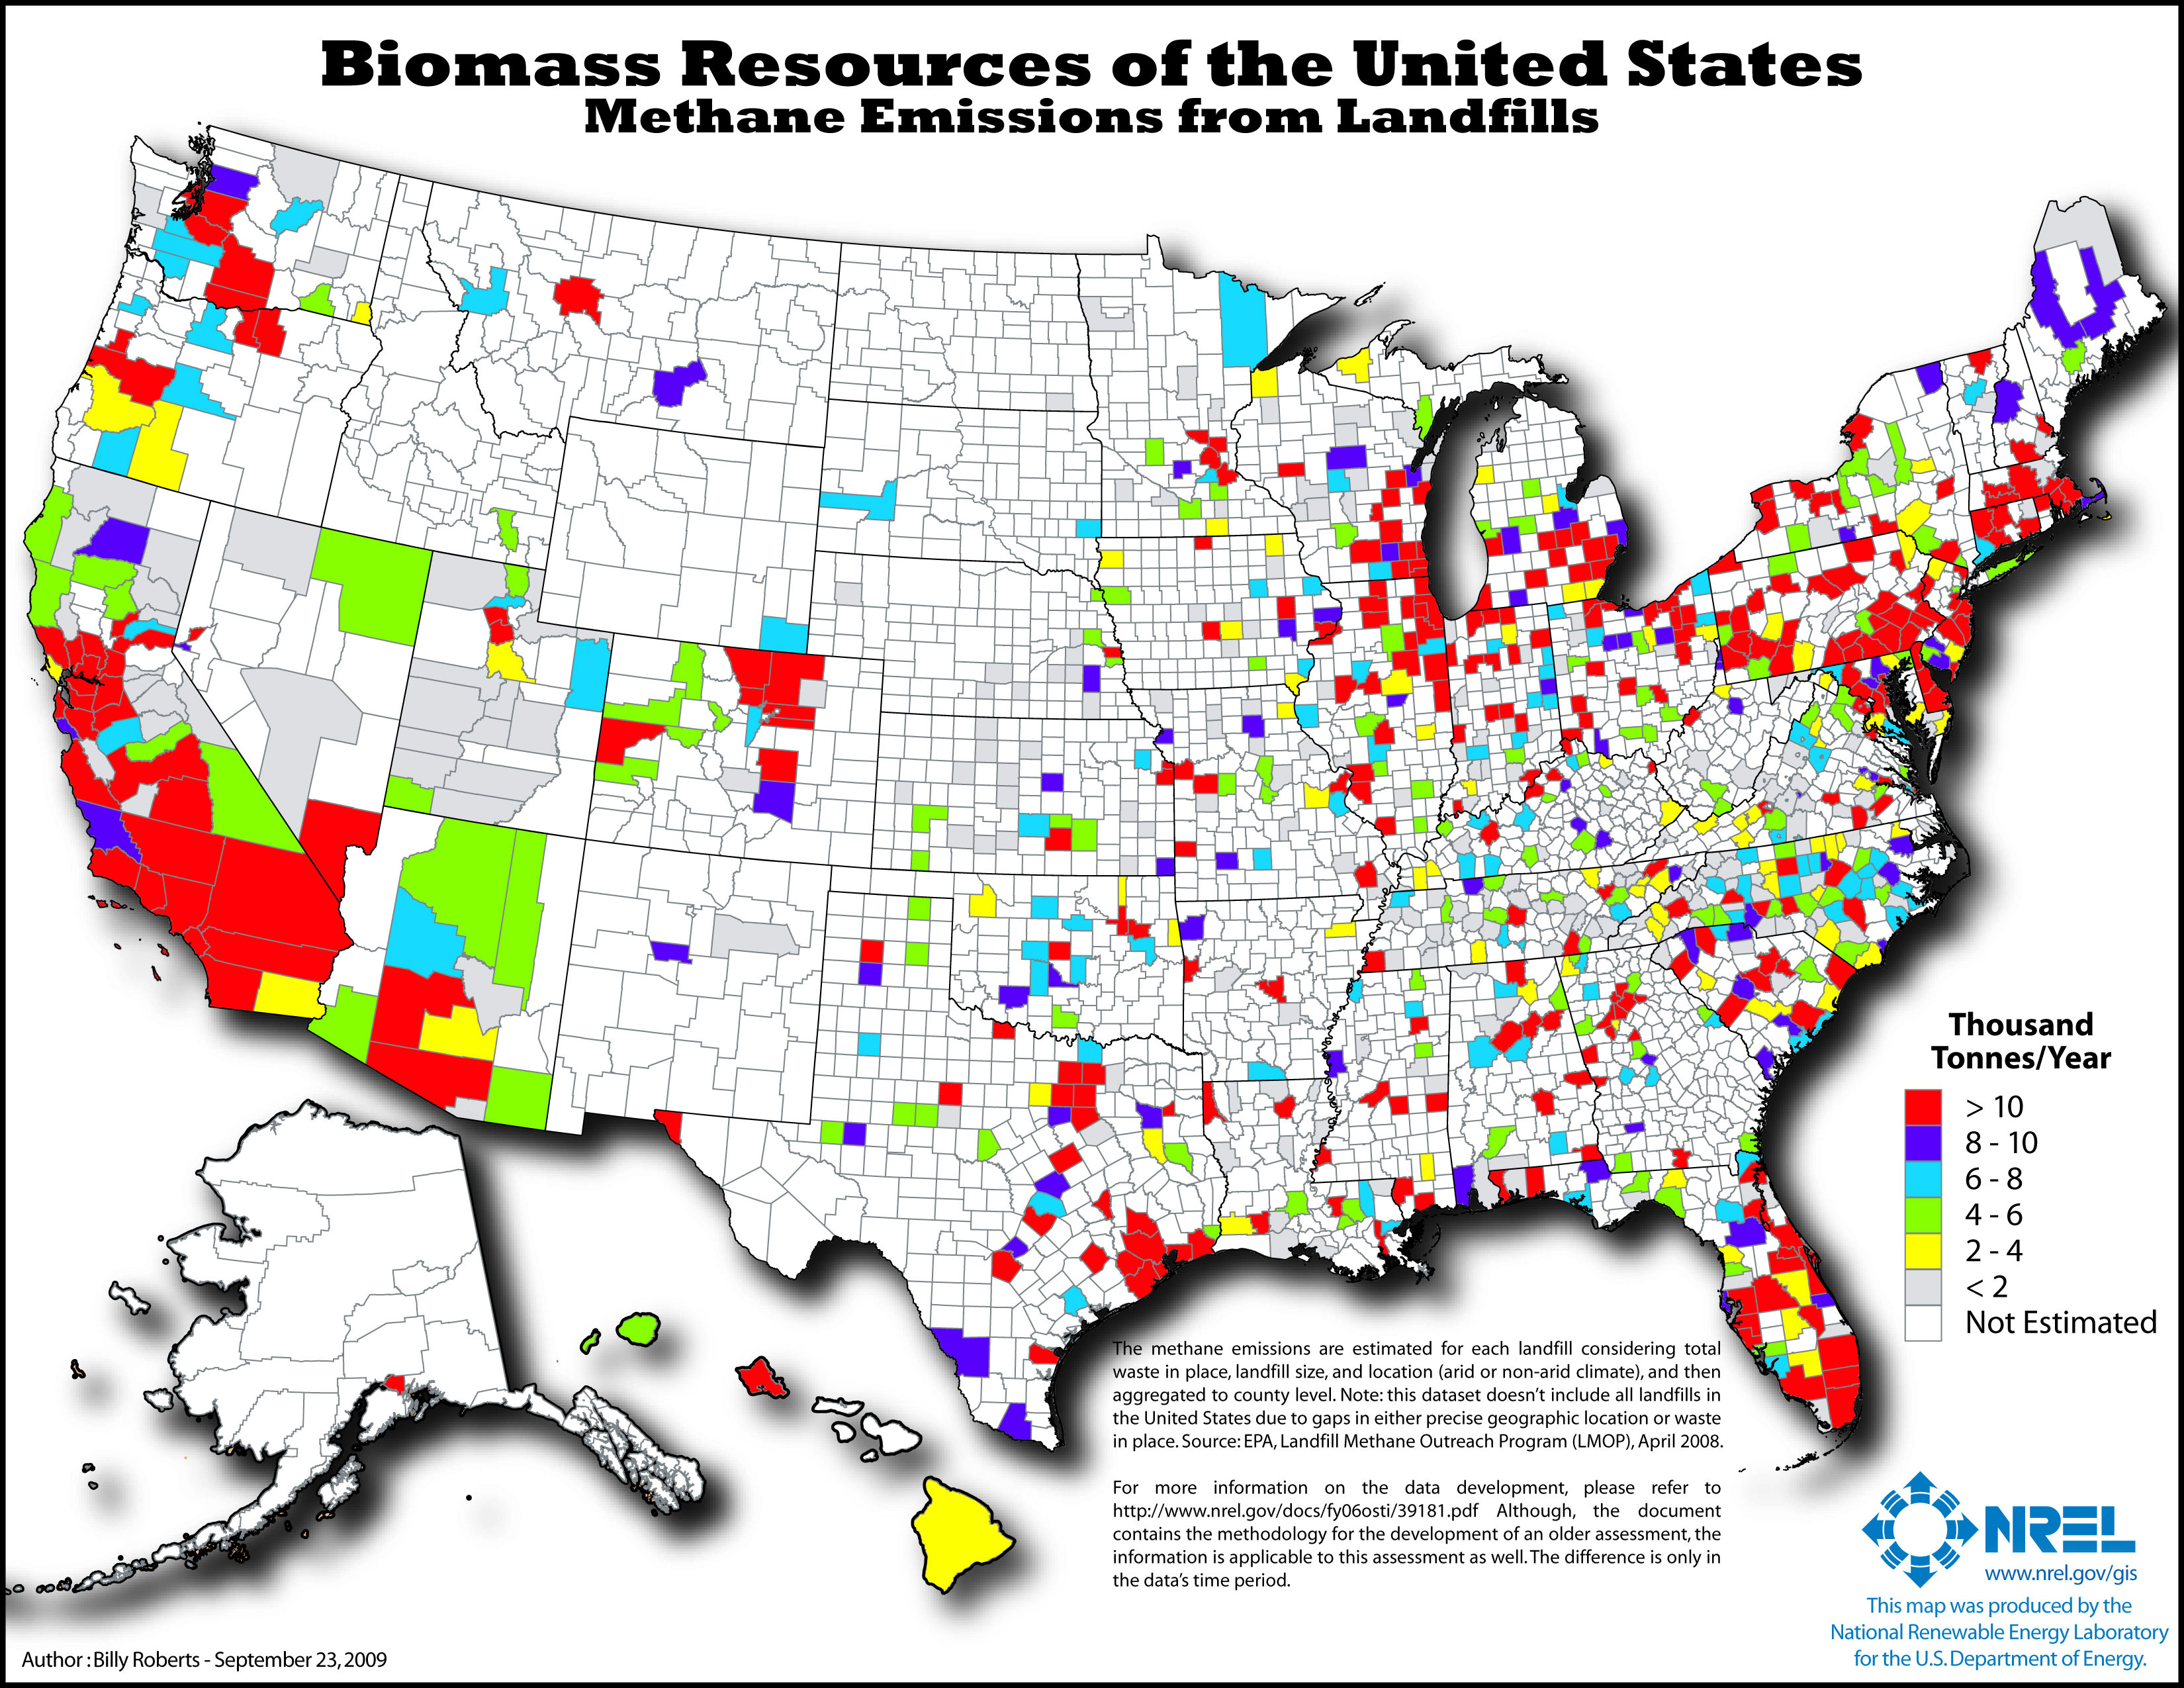
Methane emissions from landfills
The methane emissions are estimated for each landfill considering total waste in place, landfill size, and location (arid or non-arid climate), and then aggregated to county level. Note: this dataset doesn't include all landfills in the United States due to gaps in either precise geographic location or waste in place.
(View/Print/Download JPG 1.5 MB)
Gas from Manure
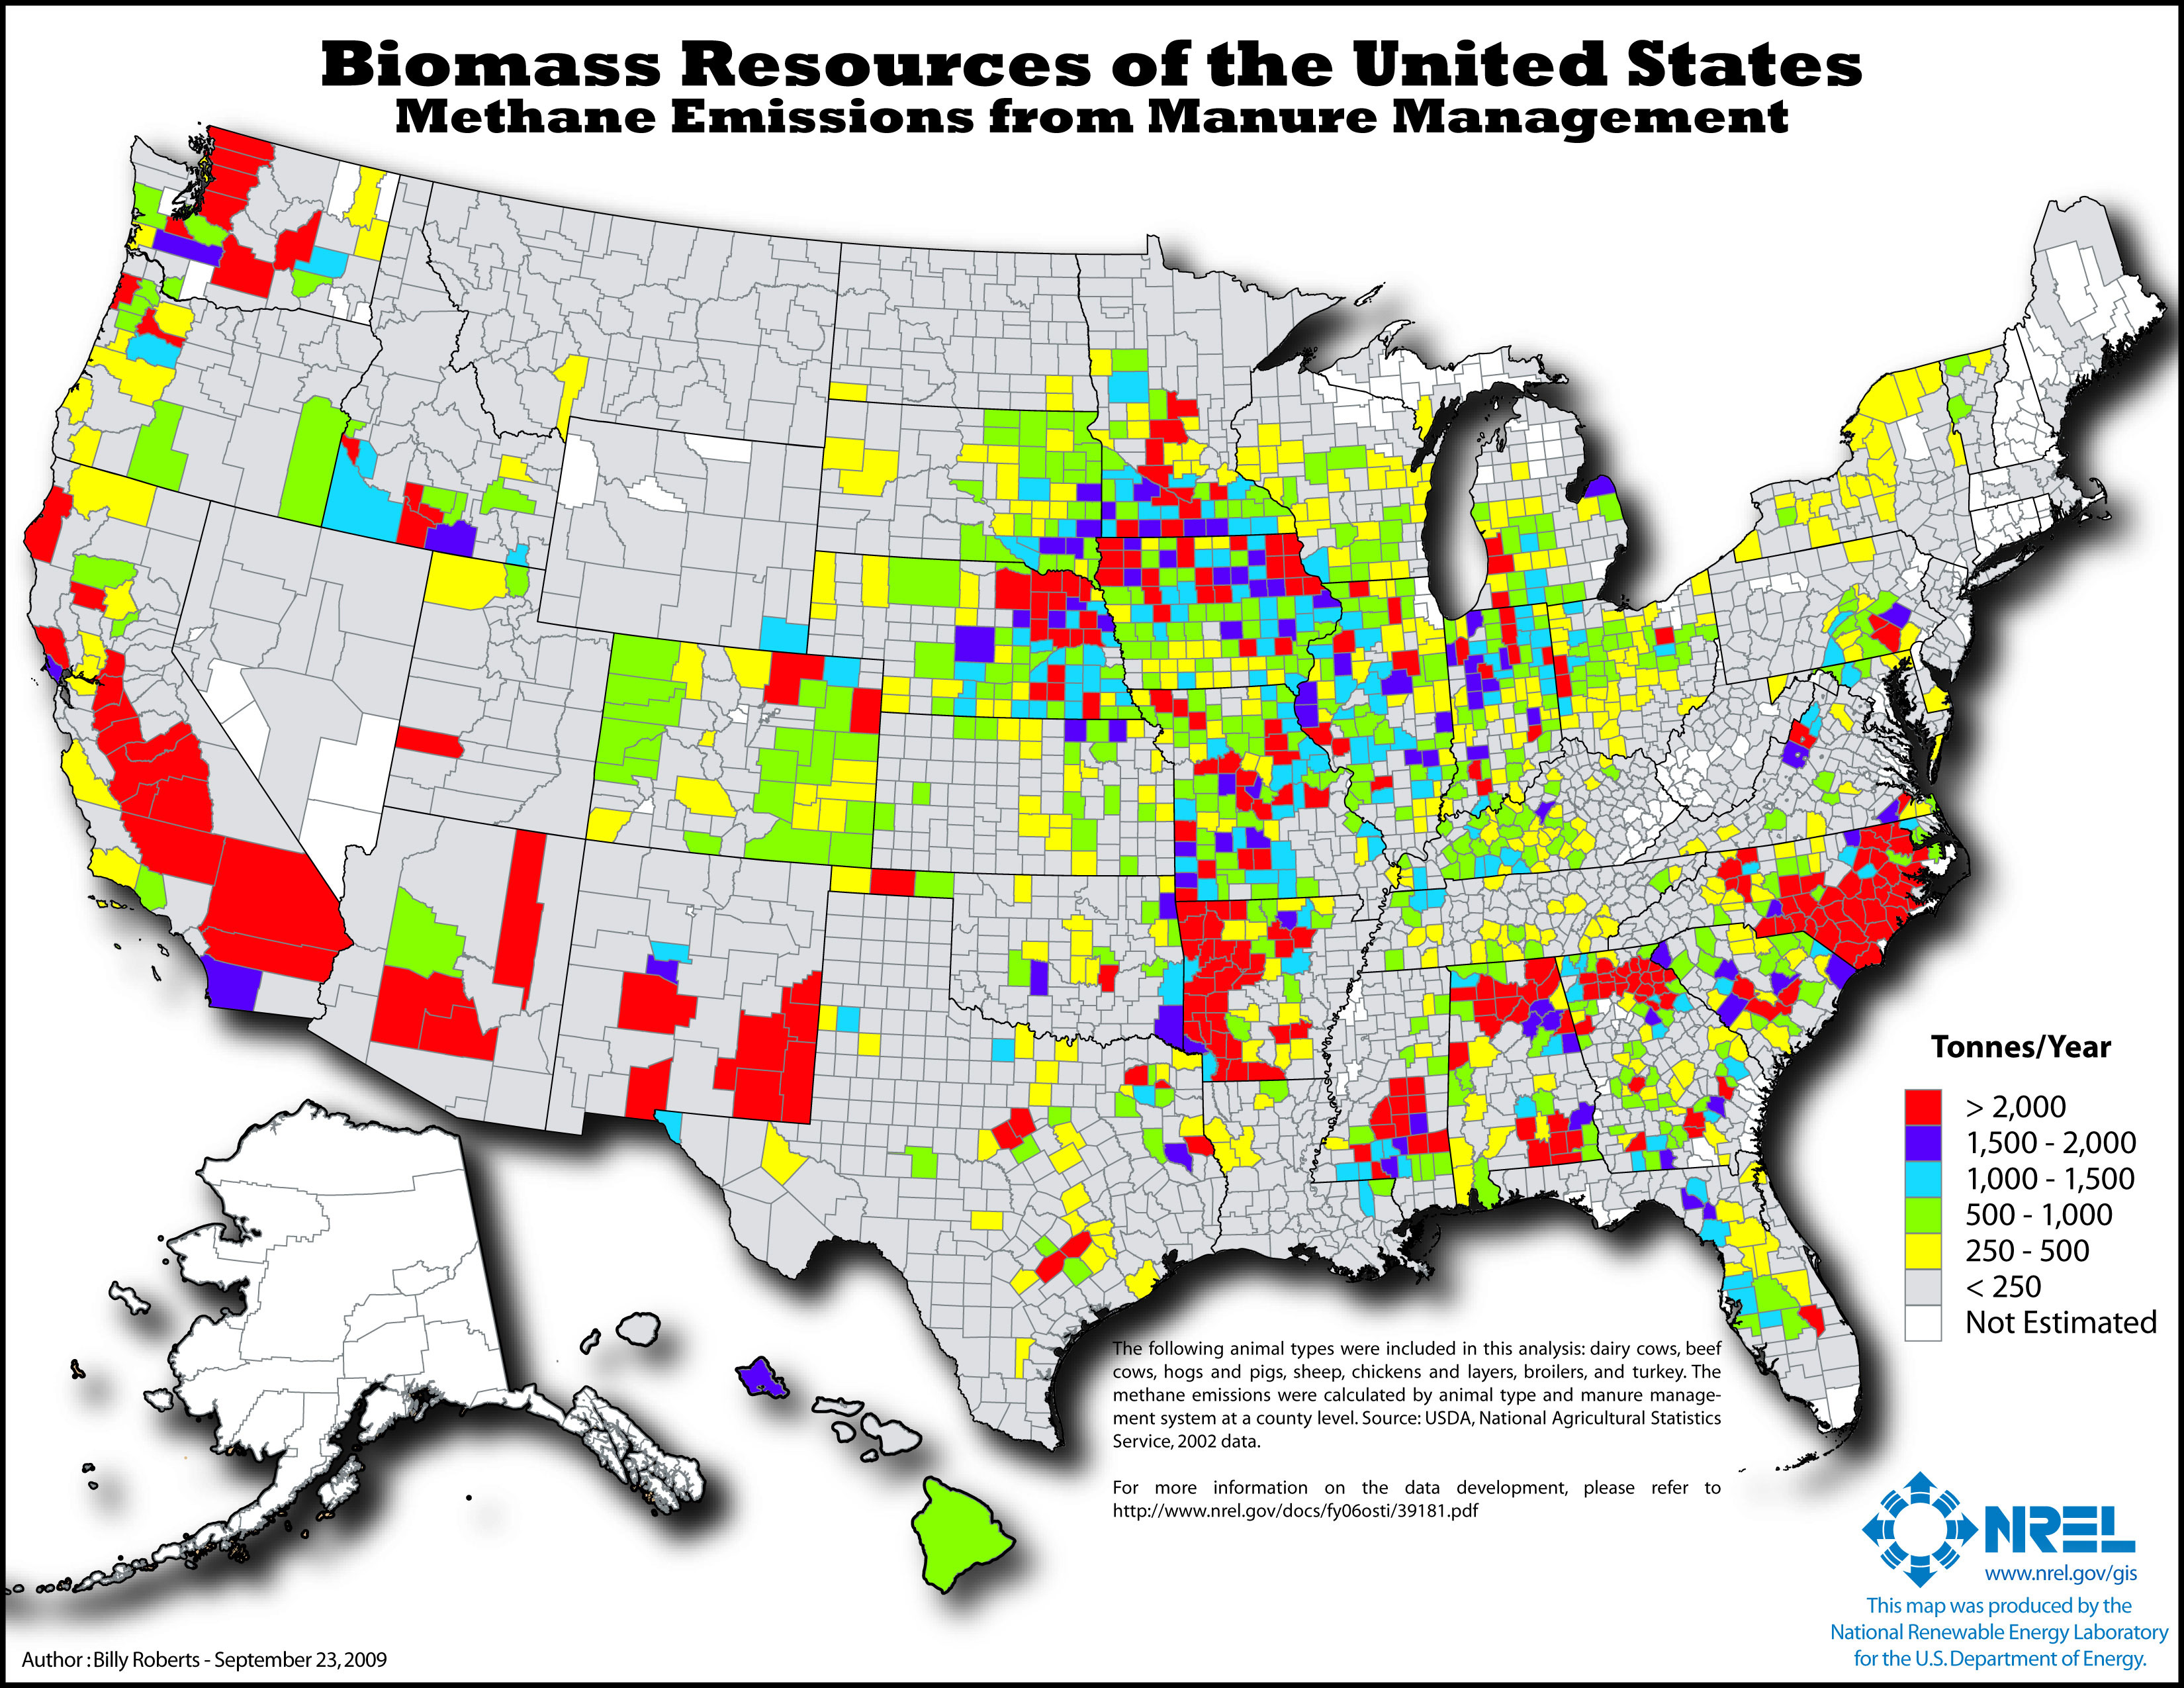
Methane emissions from manure management
The following animal types were included in this analysis: dairy cows, beef cows, hogs and pigs, sheep, chickens and layers, broilers, and turkey. The methane emissions were calculated by animal type and manure management system at a county level.
(View/Print/Download JPG 1.5 MB)
Gas from Sewage

Methane emissions from domestic wastewater treatment
The methane emissions are estimated using the methodology from the EPA Inventory of U.S. Greenhouse Gas Emissions and Sinks: 1990-2003.
(View/Print/Download JPG 1.5 MB)
Source: U.S. National Renewable Energy Laboratory
Copyright © 1993-2026 World Trade Press. All rights reserved.