


Solar maps provide monthly average daily total solar resource information on grid cells. The insolation values represent the resource available to a flat plate collector, such as a photovoltaic panel, oriented due south at an angle from horizontal to equal to the latitude of the collector location. This is typical practice for PV system installation, although other orientations are also used.
Several map variations are accessible below. For information on how these maps were developed, access the How the Maps Were Made.
Types of Maps
These maps show national solar photovoltaics (PV) resource potential and concentrating solar power (CSP) resource potential for the United States. They are available in JPEG format.
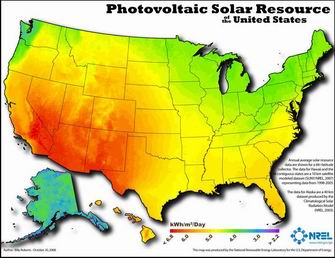
Photovoltaics
Low Resolution - JPG 111 KB
High Resolution - JPG 32.5 MB
note: Hi-Res is large!
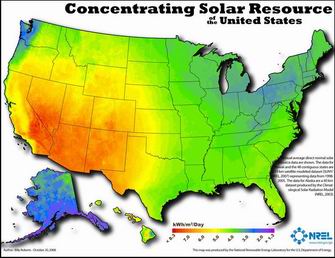
Concentrating Solar Power
Low Resolution - JPG 113 KB
High Resolution - JPG 8.7 MB
note: Hi-Res is large!
PV Solar Radiation (10 km)—Static Maps
(.jpeg images ranging in size from 105-177 KB)
These maps provide monthly average and annual average daily total photovoltaic (PV) solar resource, averaged over surface cells of 0.1 degrees in both latitude and longitude, or about 10 km in size. This data was developed using the State University of New York/Albany satellite radiation model.
| Annual (JPG 177 KB) | ||
| January (JPG 106 KB) | May (JPG 108 KB) | September (JPG 107 KB) |
| February (JPG 110 KB) | June (JPG 109 KB) | October (JPG 118 KB) |
| March (JPG 112 KB) | July (JPG 108 KB) | November (JPG 120 KB) |
| April (JPG 109 KB) | August (JPG 109 KB) | December (JPG 105 KB) |
Concentrating Solar Power Radiation (10 km)—Static Maps
(.jpeg images ranging in size from 105-127kb)
These maps provide monthly average and annual average daily total concentrating solar power (CSP) resource, averaged over surface cells of 0.1 degrees in both latitude and longitude, or about 10 km in size. This data was developed using the State University of New York/Albany satellite radiation model.
| Annual (JPG 105 KB) | ||
| January (JPG 111 KB) | May (JPG 114 KB) | September (JPG 112 KB) |
| February (JPG 112 KB) | June (JPG 110 KB) | October (JPG 109 KB) |
| March (JPG 116 KB) | July (JPG 112 KB) | November (JPG 107 KB) |
| April (JPG 114 KB) | August (JPG 127 KB) | December (JPG 121 KB) |
PV Solar Radiation (Flat Plate, Facing South, Latitude Tilt)—Static Maps
(.jpeg images ranging in size from 260-273 KB)
These maps provide monthly average daily total solar resource information on grid cells of approximately 40 km by 40 km in size. The insolation values represent the resource available to a flat plate collector, such as a photovoltaic panel, oriented due south at an angle from horizontal to equal to the latitude of the collector location.
| Annual (JPG 263 KB) | ||
| January (JPG 256 KB) | May (JPG 267 KB) | September (JPG 273 KB) |
| February (JPG 267 KB) | June (JPG 261 KB) | October (JPG 268 KB) |
| March (JPG 272 KB) | July (JPG 267 KB) | November (JPG 262 KB) |
| April (JPG 270 KB) | August (JPG 269 KB) | December (JPG 260 KB) |
Direct Normal Solar Radiation (Two-Axis Tracking Concentrator)—Static Maps
(.jpeg images ranging in size from 268-299kb)
These maps provide monthly average daily total solar resource information on grid cells of approximately 40 km by 40 km in size. The insolation values represent the resource available to concentrating systems that track the sun throughout the day.
| Annual (JPG 287 KB) | ||
| January (JPG 268 KB) | May (JPG 294 KB) | September (JPG 296 KB) |
| February (JPG 278 KB) | June (JPG 290 KB) | October (JPG 291 KB) |
| March (JPG 286 KB) | July (JPG 294 KB) | November (JPG 272 KB) |
| April (JPG 296 KB) | August (JPG 299 KB) | December (JPG 270 KB) |
Source: National Renewable Energy Laboratory (NREL) of the United States Department of Energy
Copyright © 1993-2026 World Trade Press. All rights reserved.